Trackinsight Enterprise, a unified platform for institutional ETF research, analytics, and compliance, is now live. Explore Trackinsight Enterprise →
Help us improve your experience. Please confirm your investor type:
The Ultimate ETF Comparison Tool - Try Now!
Analyze up to 5 ETFs side-by-side and gain instant insights on performance, fees, holdings, and more to make data-driven investment decisions.
ETFs Charted - Leverage & Inverse ETFs Across the Atlantic
Explore the rise of leveraged and inverse ETFs in Europe and the US.

By Trackinsight
August 1, 2024
- Leveraged ETFs
- Inverse ETFs
Advertisement
Leverage & Inverse ETFs
Leveraged and inverse ETFs have surged in popularity across Europe and the US over the past decade. Investors flock to these ETFs for their potential to amplify returns, hedge against market downturns, offer trading flexibility, and diversify tactical allocations. In this edition of the ETFs Charted newsletter, we dive into their growth, product range, performance, and leading players on both sides of the Atlantic.
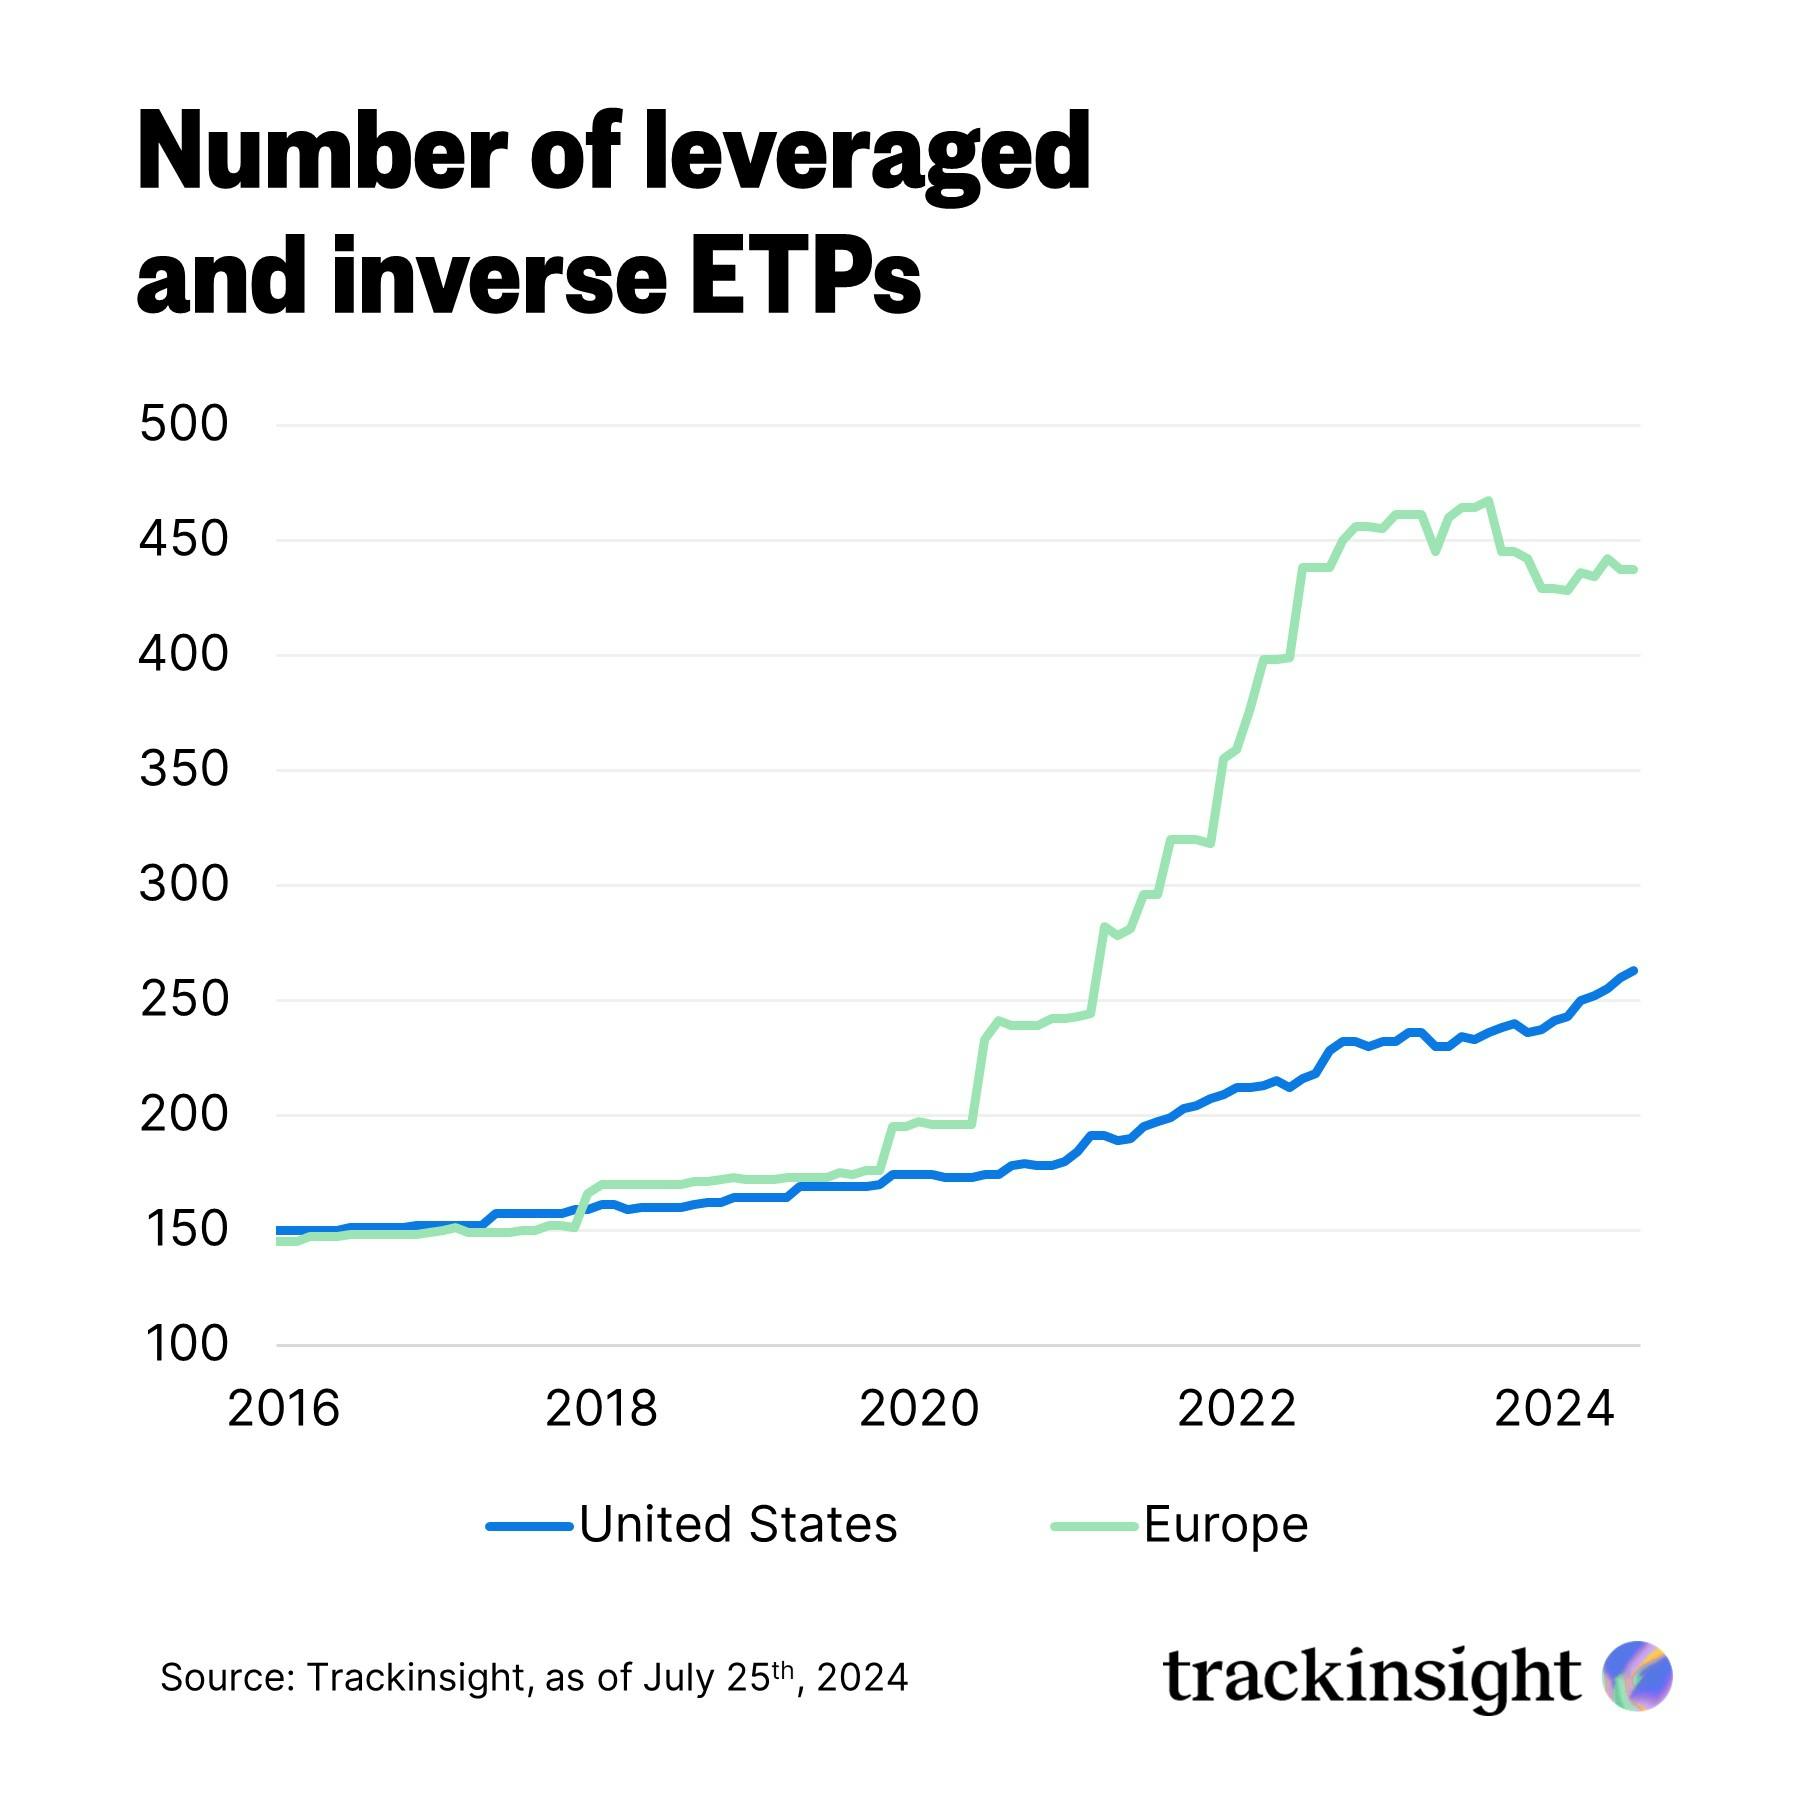
The Offerings
Europe has launched significantly more leveraged and inverse ETPs compared to the US, especially since mid-2020 during the pandemic.
📊 Share your ETF outlook
From AI infrastructure to active strategies, the ETF landscape is shifting. Share your perspective in the 7th Annual Global ETF Survey and get exclusive early access to the final report.
The Assets
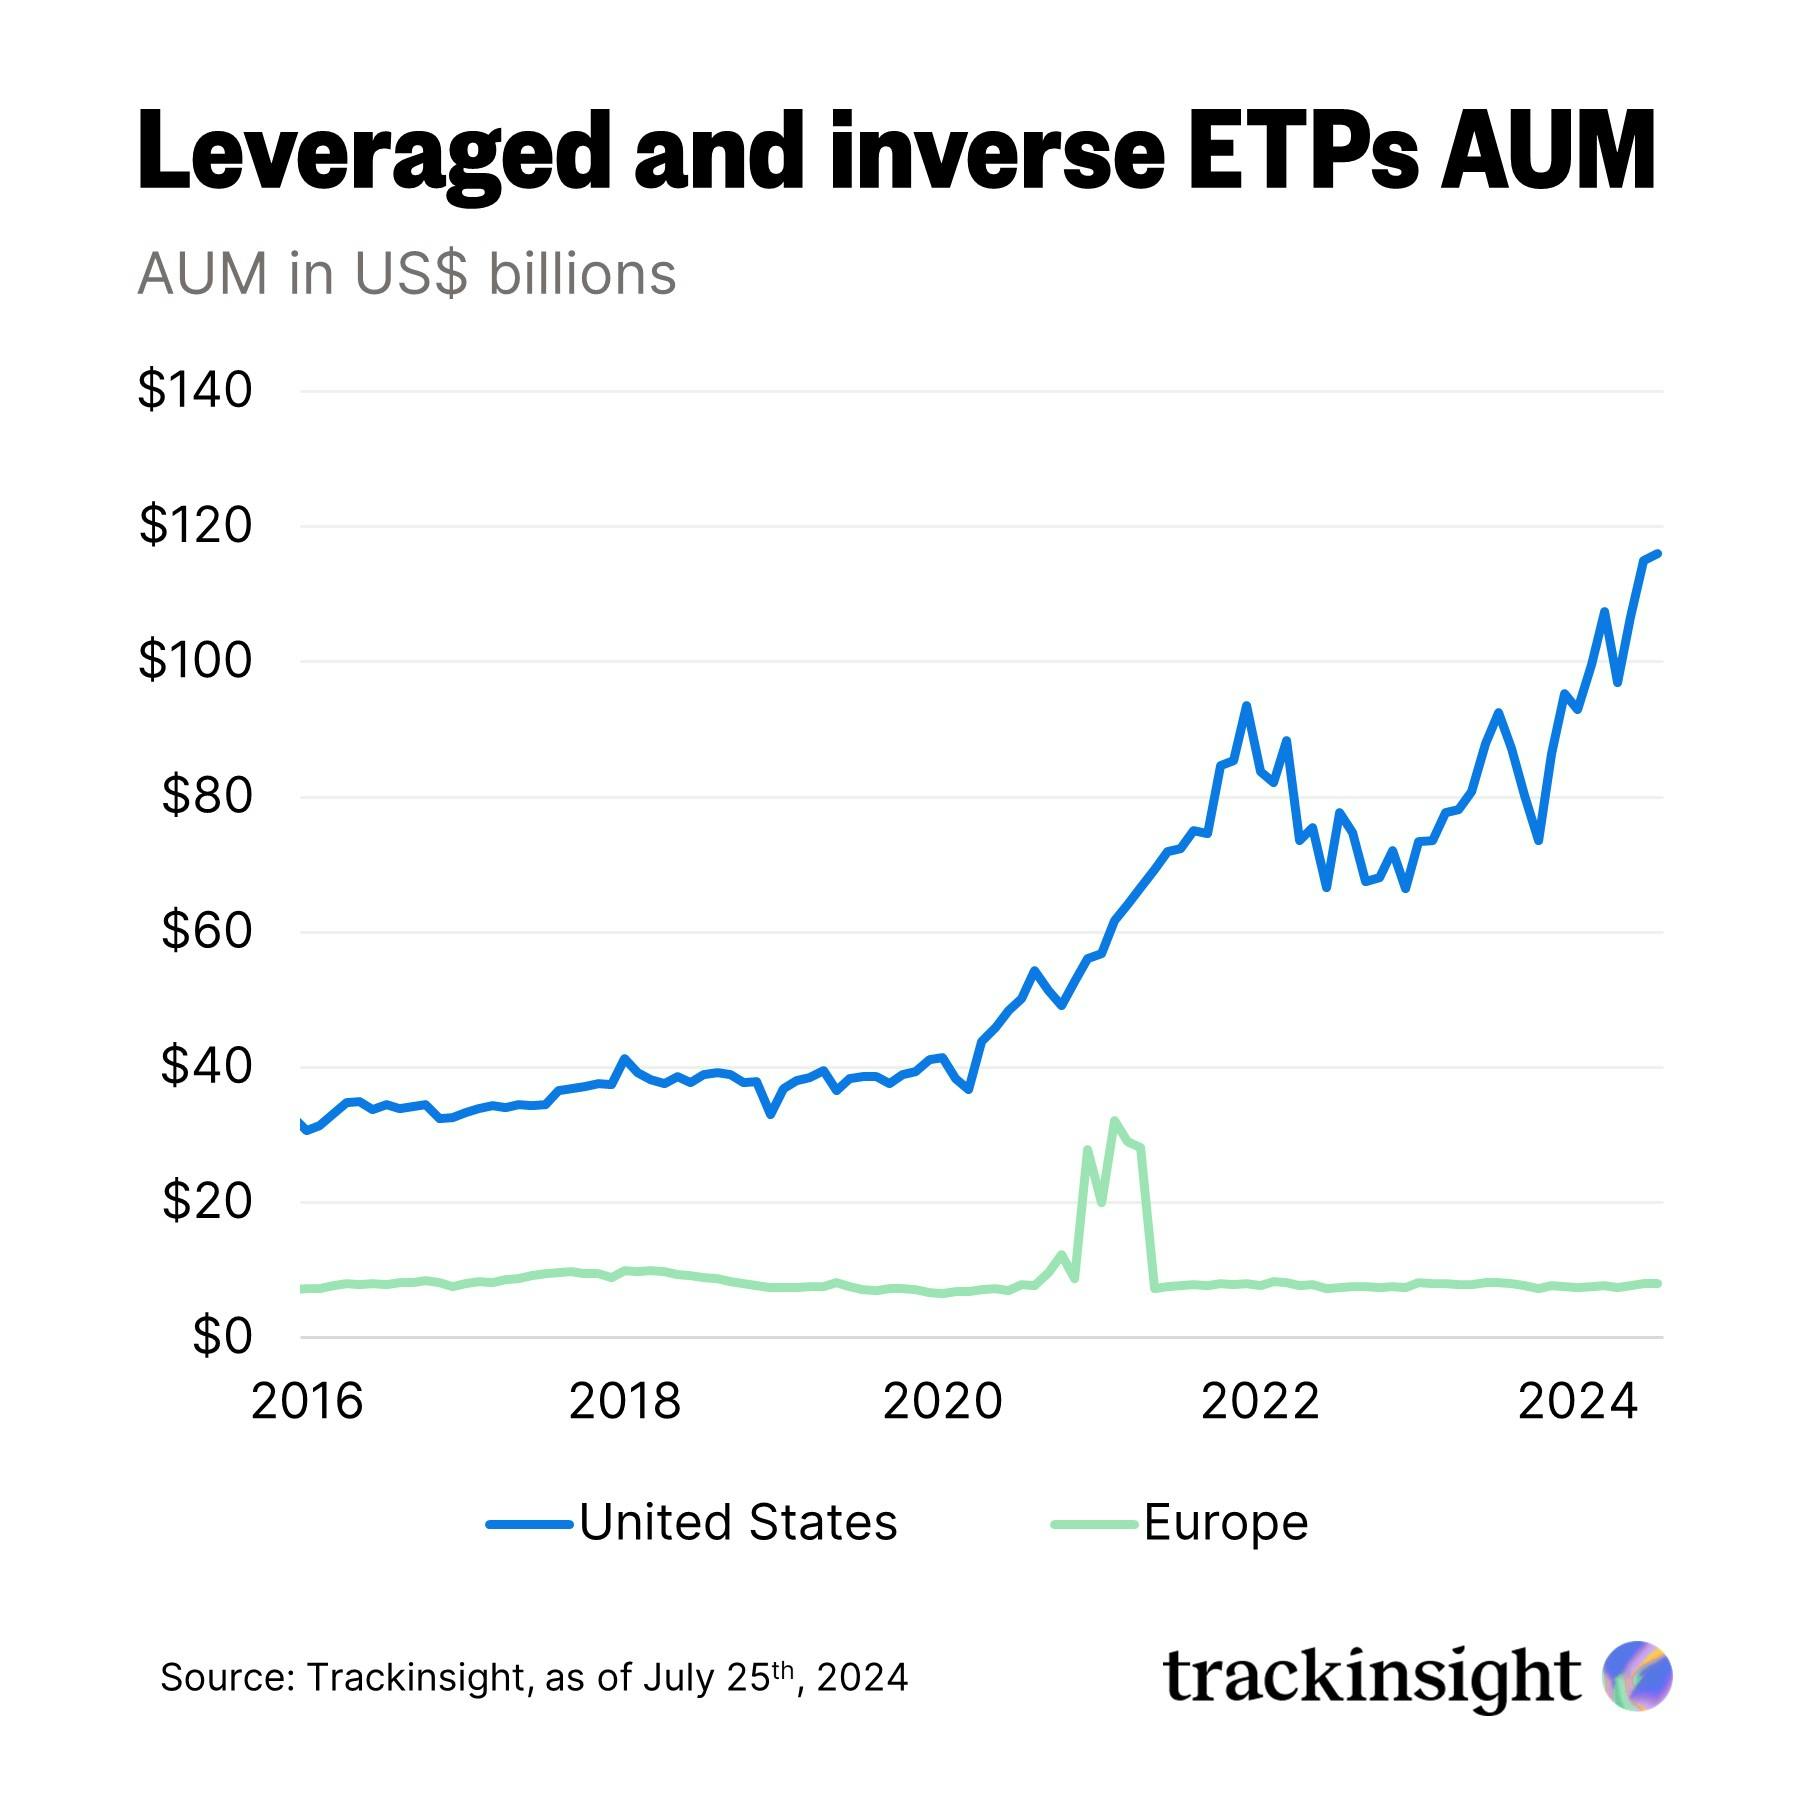
Leveraged and inverse ETFs have seen a dramatic divergence in growth between the US and European markets. While US AUM in this category have surged steadily, nearing $120 billion, Europe has experienced much flatter growth, fluctuating between $7 and $9 billion. A brief spike in late 2020 and early 2021 was followed by a return to this range.
Breakdown by Asset Class
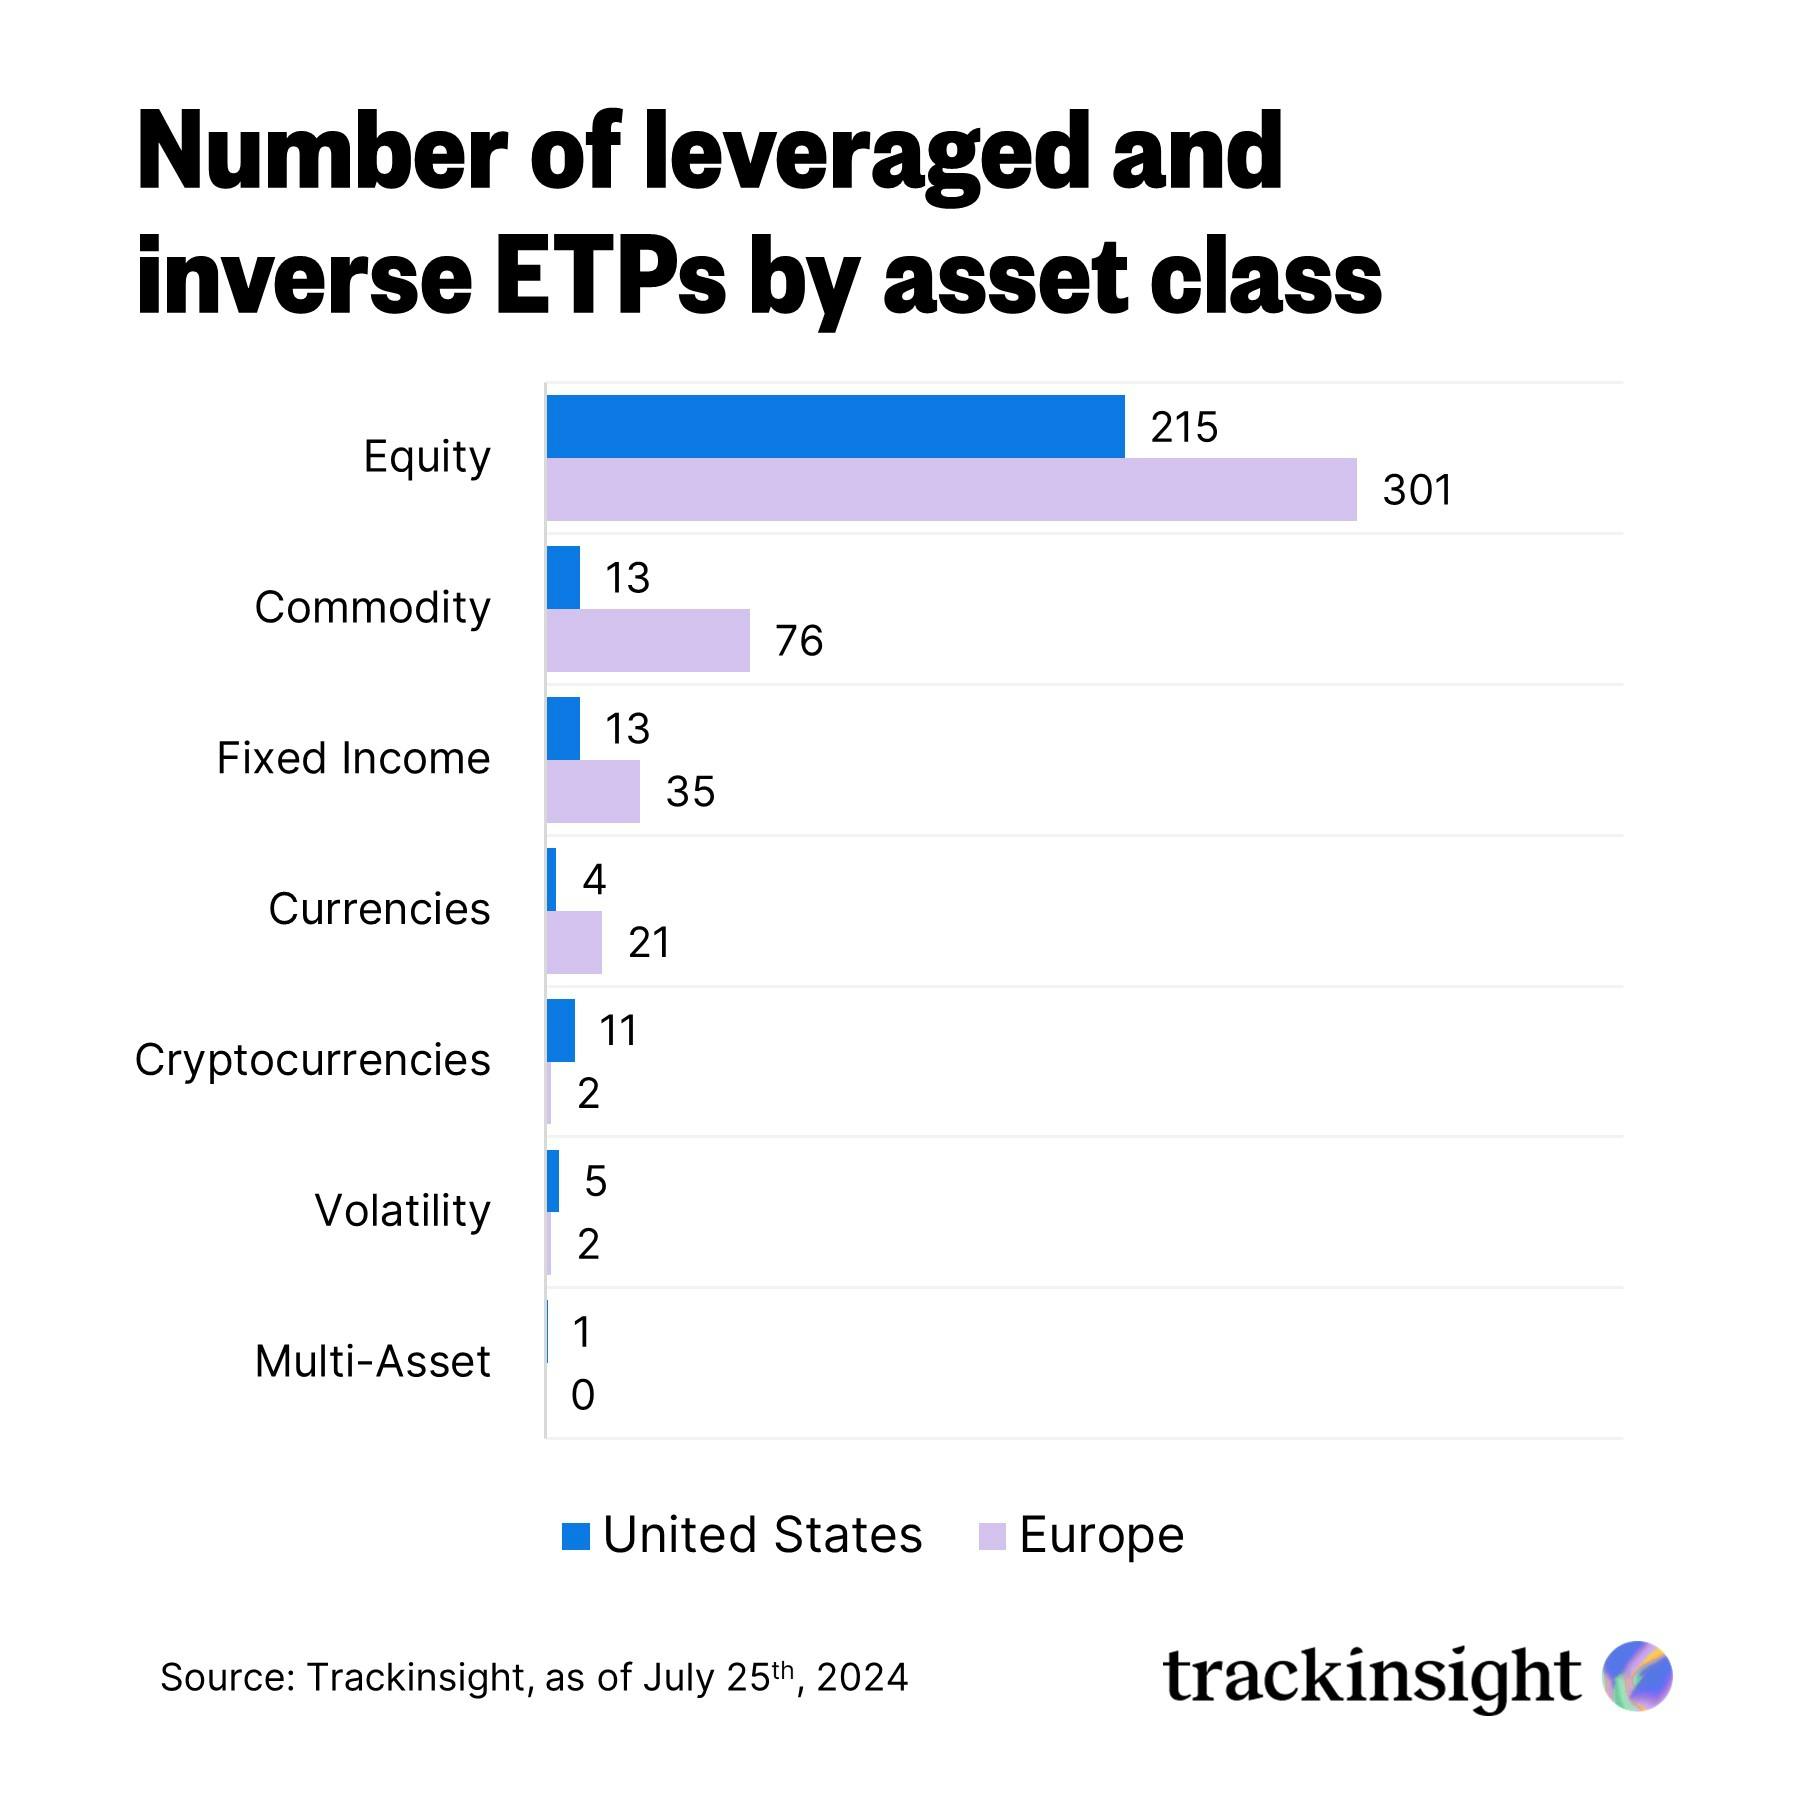
Equity ETFs dominate both regions, while Europe boasts a wider range of leveraged and inverse ETFs across asset classes like fixed income, commodities, and currencies compared to the USA, which has a stronger presence in cryptocurrency and volatility ETFs.
Breakdown by Leverage Factor
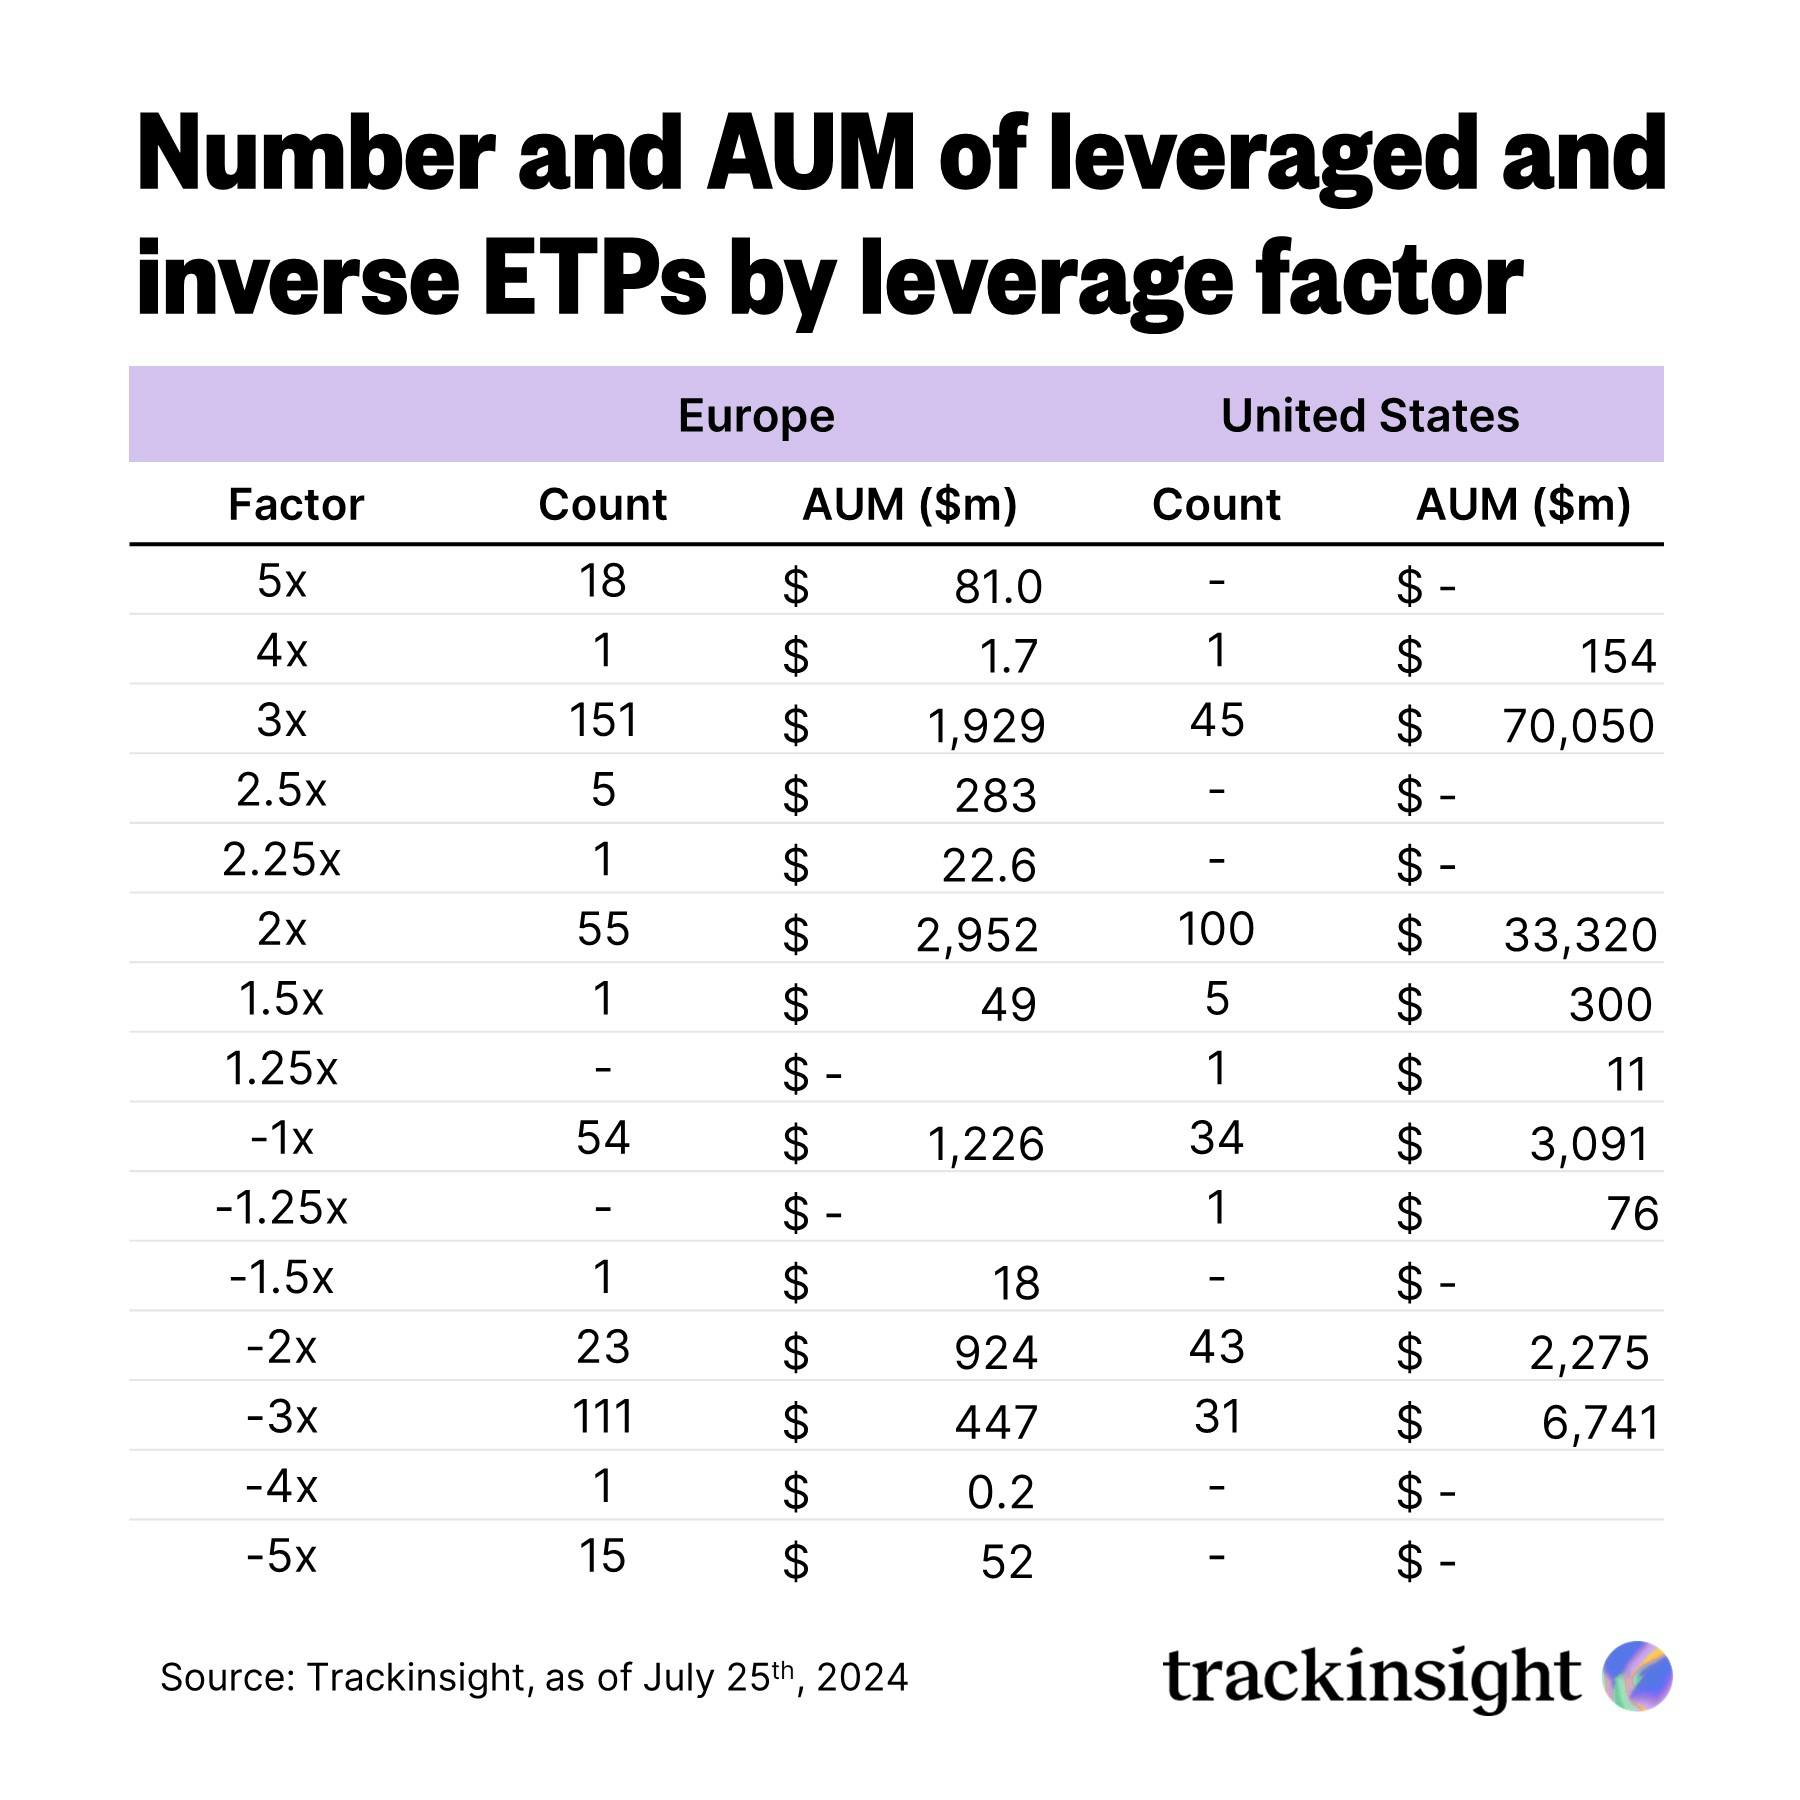
Europe offers a broader variety of leveraged and inverse ETFs, particularly in the 3x category with 151 products ($1,929 million AUM) and significant numbers in inverse categories like -1x and -3x. However, the U.S. leads in assets, especially in 3x ETFs (45 products, $70,050 million AUM) and 2x ETFs (100 products, $33,320 million AUM).
In the inverse category, the U.S. also has higher AUM, particularly for -1x and -3x ETFs.
The Flows
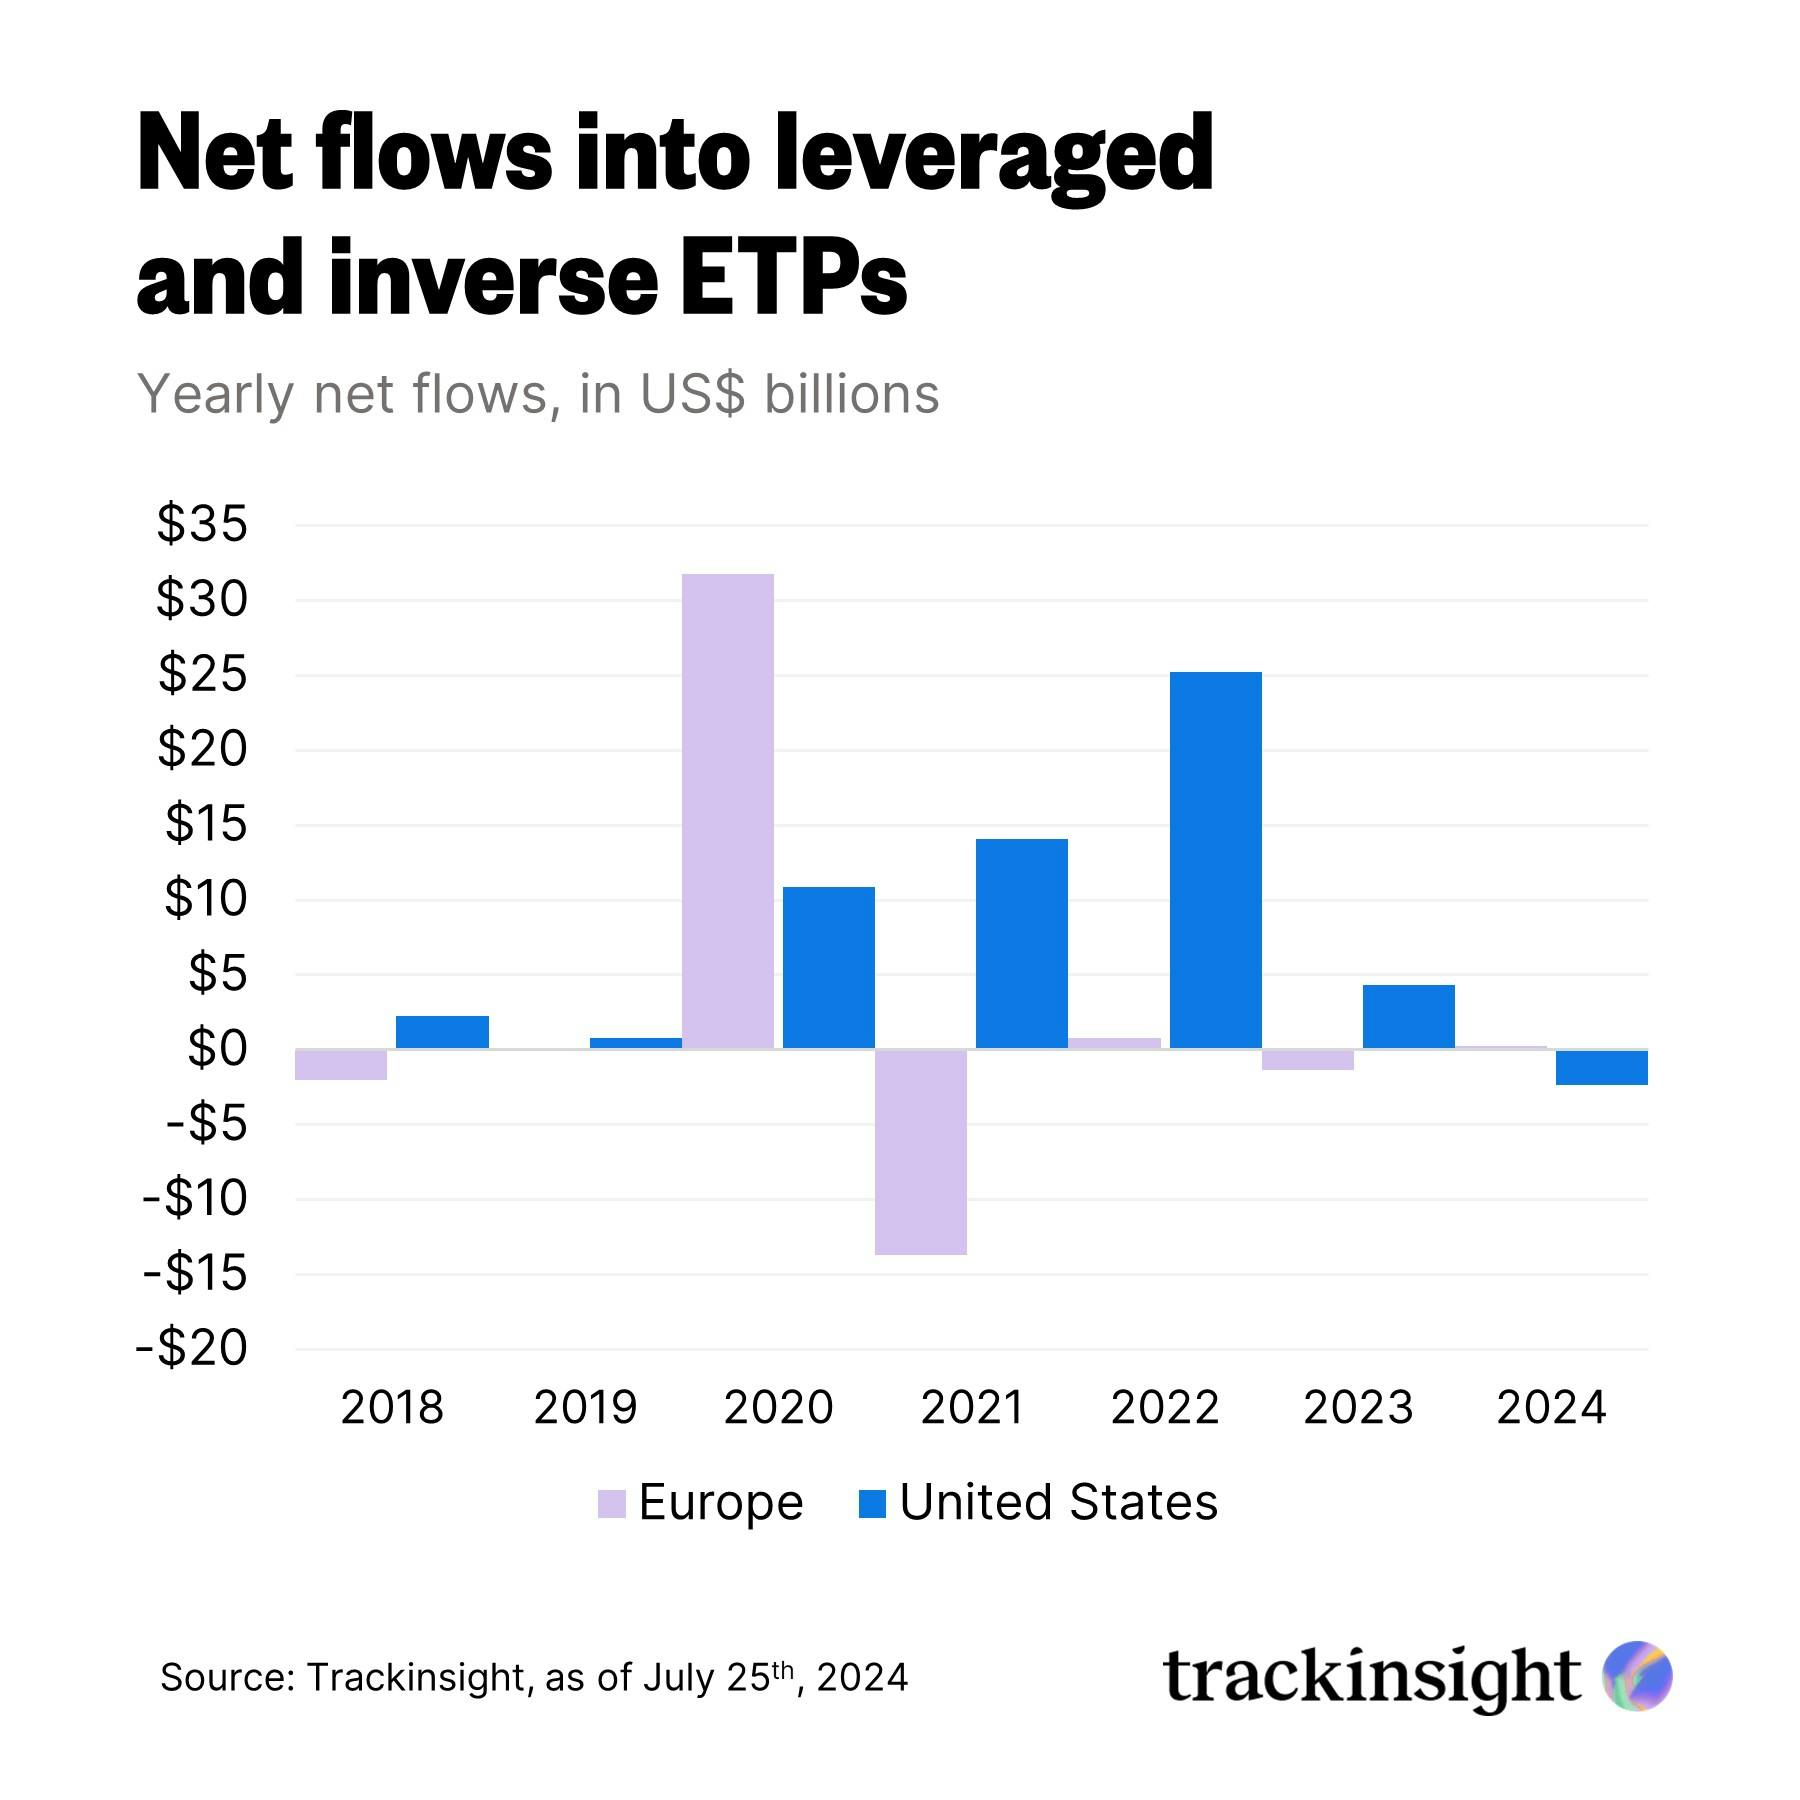
Net inflows into leveraged and inverse ETFs in the U.S. have significantly tapered off after a robust period between 2020 and 2022. The trend has reversed in 2023, with net outflows reaching -$2.37 billion thus far. In contrast, European markets have exhibited more volatile net flows in these ETF categories over the years.
The Leaders
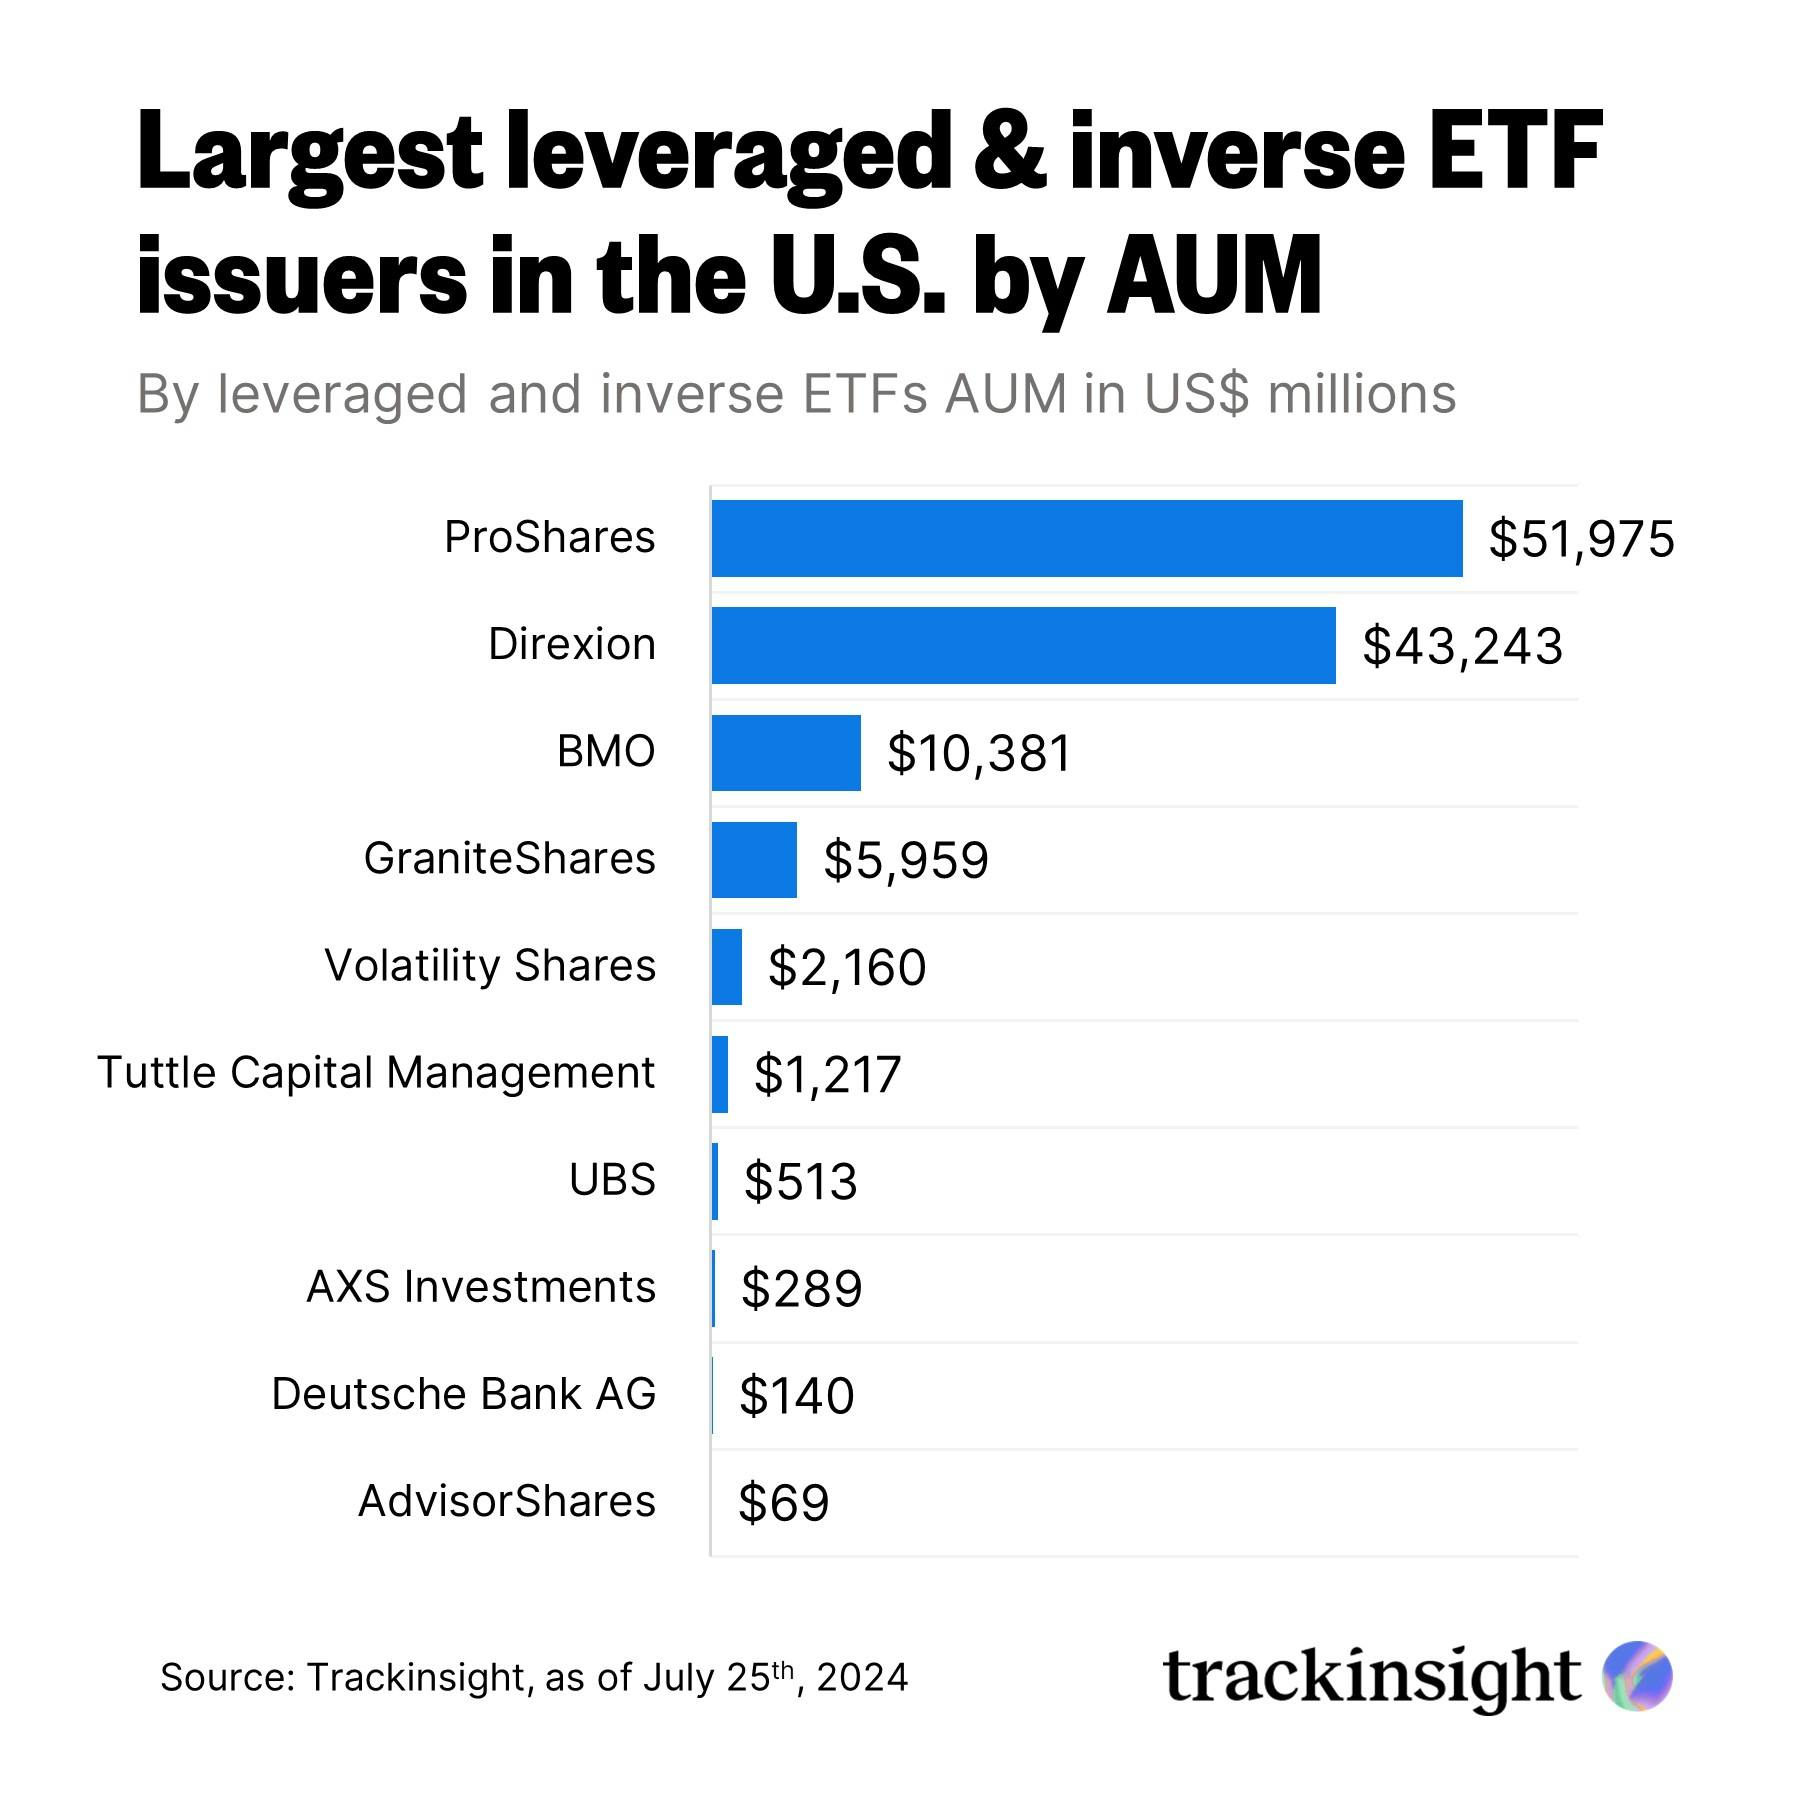
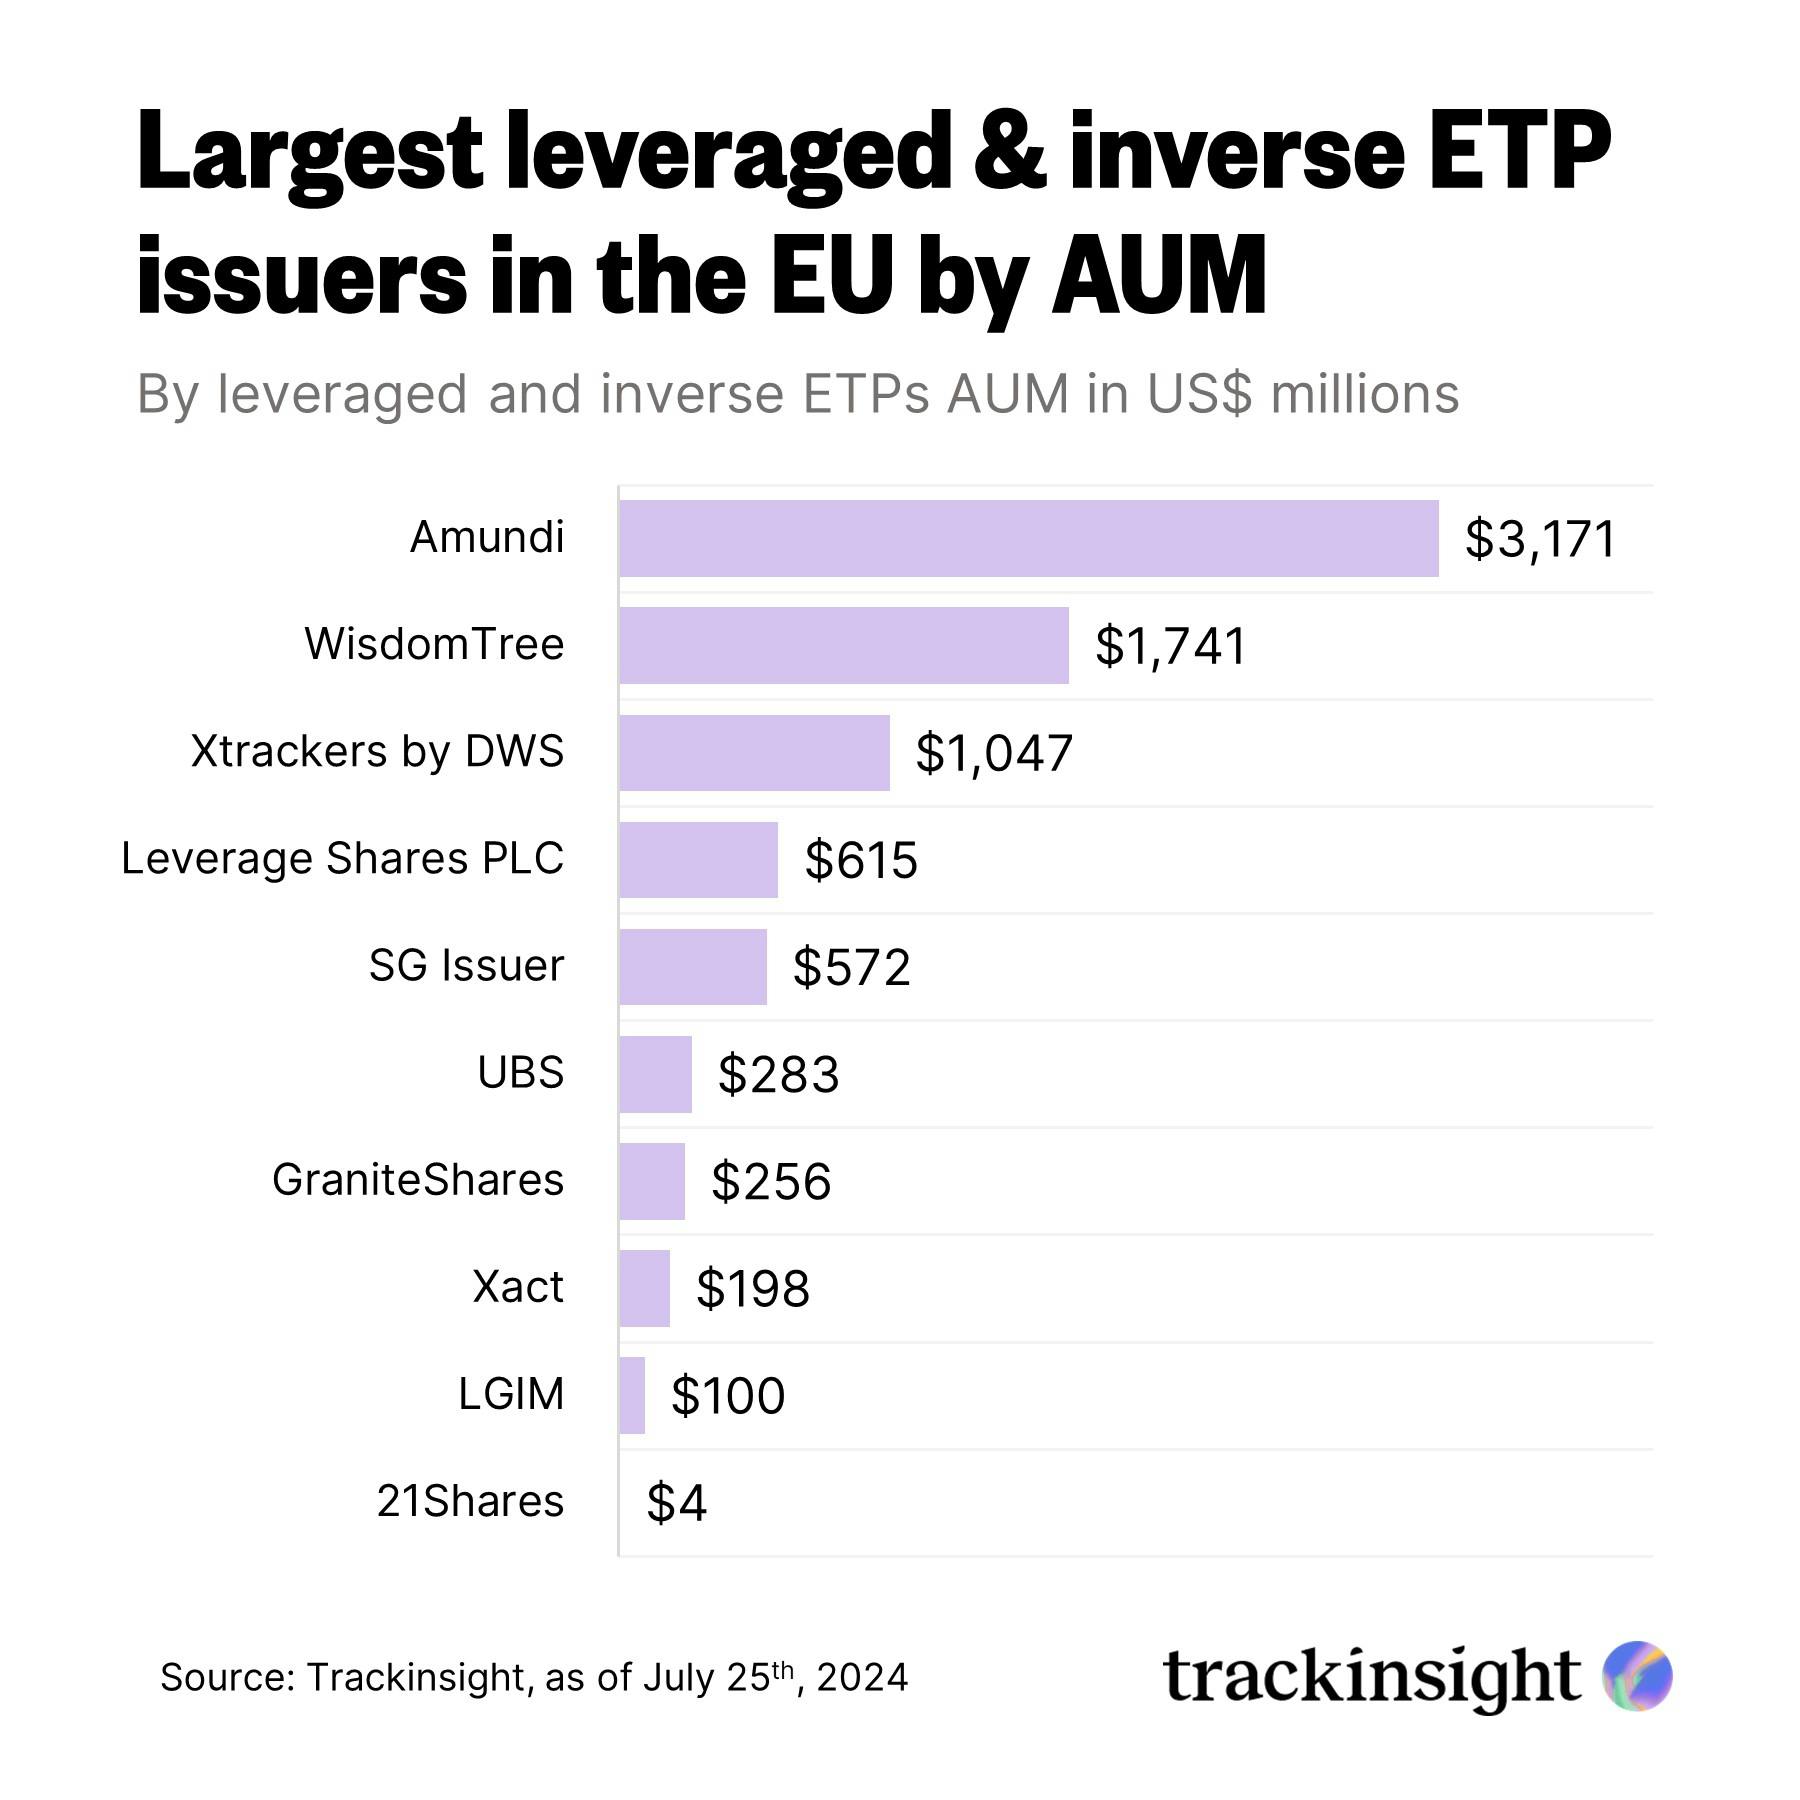
The following two charts shows the largest issuers of leveraged and inverse ETFs in Europe and the United States.
Please note this article is for information purposes only and does not in any way constitute investment advice. It is essential that you seek advice from a registered financial professional prior to making any investment decision.
More articles


About Trackinsight
Since our founding in 2016, we have been at the forefront of the industry, delivering accessible, comprehensive, and reliable tools to support the evolving needs of investors.
Over the past decade, Trackinsight has expanded its operations across six countries, serving thousands of professional investors. We’ve consistently innovated to provide cutting-edge solutions that meet the changing demands of the ETF market.
In 2024, Kepler Cheuvreux, a leading independent European financial services firm, acquired a majority stake in Trackinsight, becoming the company's principal shareholder.
This strategic partnership solidifies Trackinsight's position as a premier provider of ETF selection and analysis tools, while strengthening Kepler Cheuvreux’s commitment to becoming a leading player in the ETF sector.
Together, we are committed to offering advanced services that empower professional investors, advisors, institutions, and issuers. This new step enables us to deliver even more comprehensive and innovative technological solutions, driving ETF investing to new heights.
More about TrackinsightETF TOOLS
PLATFORM
ETF NEWS & RESEARCH
Privacy policy | Cookie policy | | Terms of use | Imprint